Shutterbugs Program Impact
We integrate a formal evaluation process into our Introductory Course teachings, and we survey our Shutterbugs students at three fixed time points: baseline, mid-program, and post-program, across 6 weeks. We ask students to tell us how much you feel you know so far about the following things:
(0 means you do not know anything about it, 10 means you feel like an expert)
2021 Shutterbugs Program Learning Outcomes Kids 8-12
| Rated on a 1-10 scale | Mean Knowledge Rating BEFORE | Mean Knowledge Rating AFTER |
| How to Use a Camera | 4.07 | 8.10 |
| How to Frame a Photo | 1.95 | 6.22 |
| How to Use Perspective | 2.08 | 7.27 |
| How to Express Myself Through Photography | 2.97 | 7.05 |
| How to Tell Stories Using Photos | 3.03 | 6.95 |
Program Impact on Quality of Life
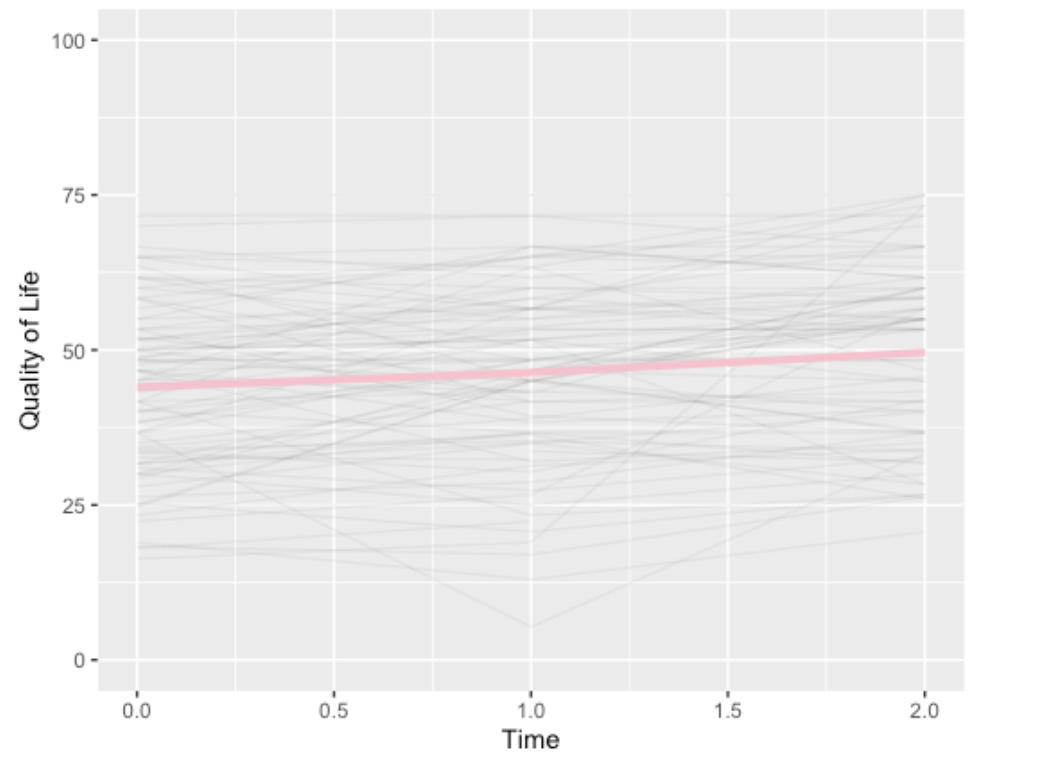
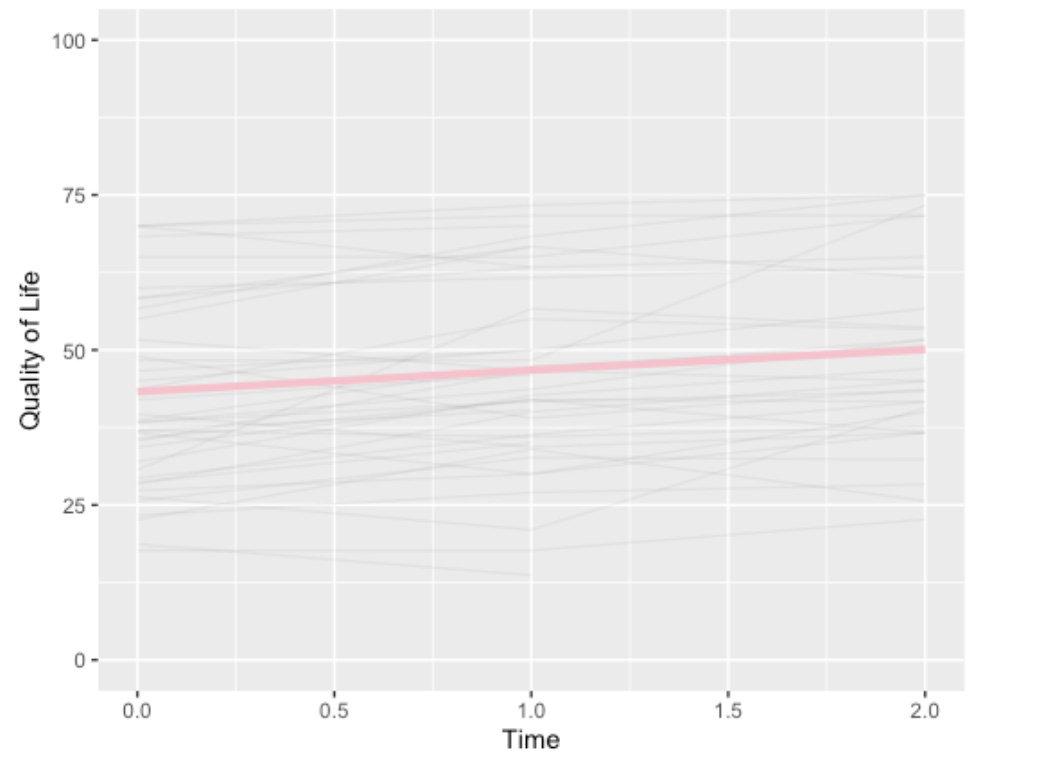
We measure the courses’ quality of life impacts and have found that participation in the program has a positive effect on our Shutterbugs.
Preliminary results* reveal that regardless of age, diagnosis, race, treatment status, pain level, gender, and socioeconomic status, participation in our Shutterbugs program increases the Quality of Life (QOL) of children and teens living with cancer.
*Sarah M. Wells, M.S., Kerstin Lynam, M.B.A., Howard Smith, Ph.D., Neill F. Piland, Ph.D. & Raul Lorenzano Researcher affiliated institutes: University of Nevada, Las Vegas, University of Washington Tacoma, Idaho State University Institute of Rural Health, and The Pablove Foundation
Virtual Shutterbugs Race/Ethnicity Distribution by Cohort 2021-2022
| Spring 2021 | Fall 2021 | Spring 2022 | All Cohorts | |||||
| # of Students | % Total | # of Students | % Total | # of Students | % Total | # of Students | % Total | |
| American Indian/Alaska Native | 1 | 1.1% | - | - | 3 | 3.0% | 4 | 1.5% |
| Asian/Asian American | 14 | 15.2% | 14 | 16.7% | 10 | 10.1% | 38 | 13.8% |
| Black/African American | 7 | 7.6% | 8 | 9.5% | 10 | 10.1% | 25 | 9.1% |
| Caucasian/Anglo American/White | 25 | 27.2% | 34 | 40.5% | 33 | 33.3% | 92 | 33.5% |
| Hispanic/Latino | 32 | 34.8% | 18 | 21.4% | 30 | 30.3% | 80 | 29.1% |
| Middle Eastern | 1 | 1.1% | 1 | 1.2% | 1 | 1.0% | 3 | 1.1% |
| Native Hawaiian/Pacific Islander | 1 | 1.1% | - | - | 1 | 1.0% | 2 | 0.7% |
| Other | 1 | 1.1% | 3 | 3.6 | 3 | 3.0% | 7 | 2.5% |
| Declined to State | 10 | 10.9% | 6 | 7.1 | 8 | 8.1% | 24 | 8.7% |
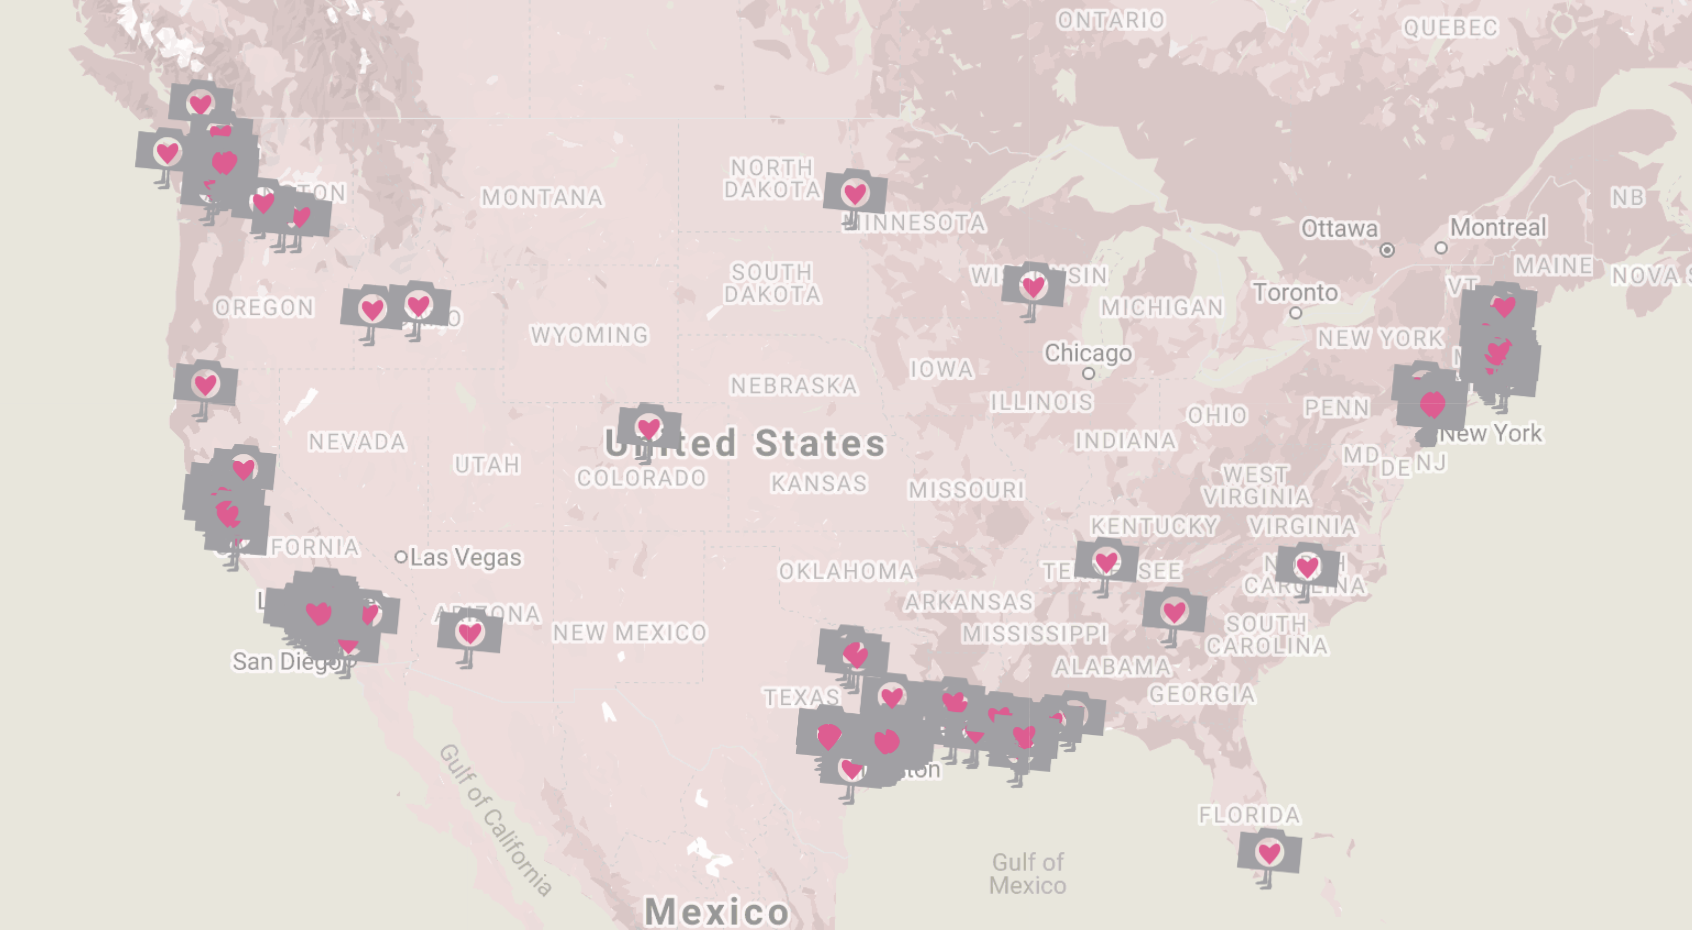
Map of students served
Adding virtual class offerings has allowed our impact to reach more students across the United States.


We know that we do teach art knowledge
If you want to see more about the impact of what we do at the Pablove Foundation, check out our 2022-2023 Impact Report.

